The New Topics Arriving on Local-Government Feeds: Data Centers, E‑Bikes, Cameras, and AI Are Rising Fastest
Every communications calendar is mostly the same year to year — meetings, closures, events, weather. But underneath the routine, the subjects local governments post about are shifting, and a few are climbing fast. We compared what 4,705 U.S. city and county governments posted in the first eight months of 2026 against the same window in 2025 — more than a million posts — and measured which topics are gaining the most ground. Four stand out, they have something in common, and two of them are the kind of post residents react to hardest.
- Data centers roughly doubled their share of the conversation year over year — and grew 2.75× among the governments we tracked in both years. It’s the most robust riser we found.
- E‑bikes and e‑scooters are the broadest: 967 governments posted about them in 2026, up 2.5× by share.
- License‑plate (Flock) cameras went from essentially absent — a single post in our 2025 window — to 332 posts across 217 governments.
- AI in city services nearly doubled its share (1.8×), now in the feeds of 303 governments.
- The catch for your calendar: the two most contested risers, data centers and cameras, earn about 4× the engagement of a typical post. These aren’t quiet announcements — they’re the posts that fill your comments.
In this report: What’s climbing · What the risers have in common · The ones that fill your comments · What isn’t rising · What to do with this · How we measured it
What’s climbing — and how we know it’s real
The number of governments we track more than tripled between these two windows — from 1,511 posting in early 2025 to 4,705 in early 2026 — so raw post counts are up almost everywhere, which tells you nothing. To find what’s genuinely rising, we measure each topic’s share of the conversation: how many posts, out of every 10,000, are about it. Then we run the honest check — we recompute the same shares using only the 1,480 governments we tracked in both years, so a growing topic has to grow among the same accounts, not just because we added more of them.
Four topics clear that bar comfortably.
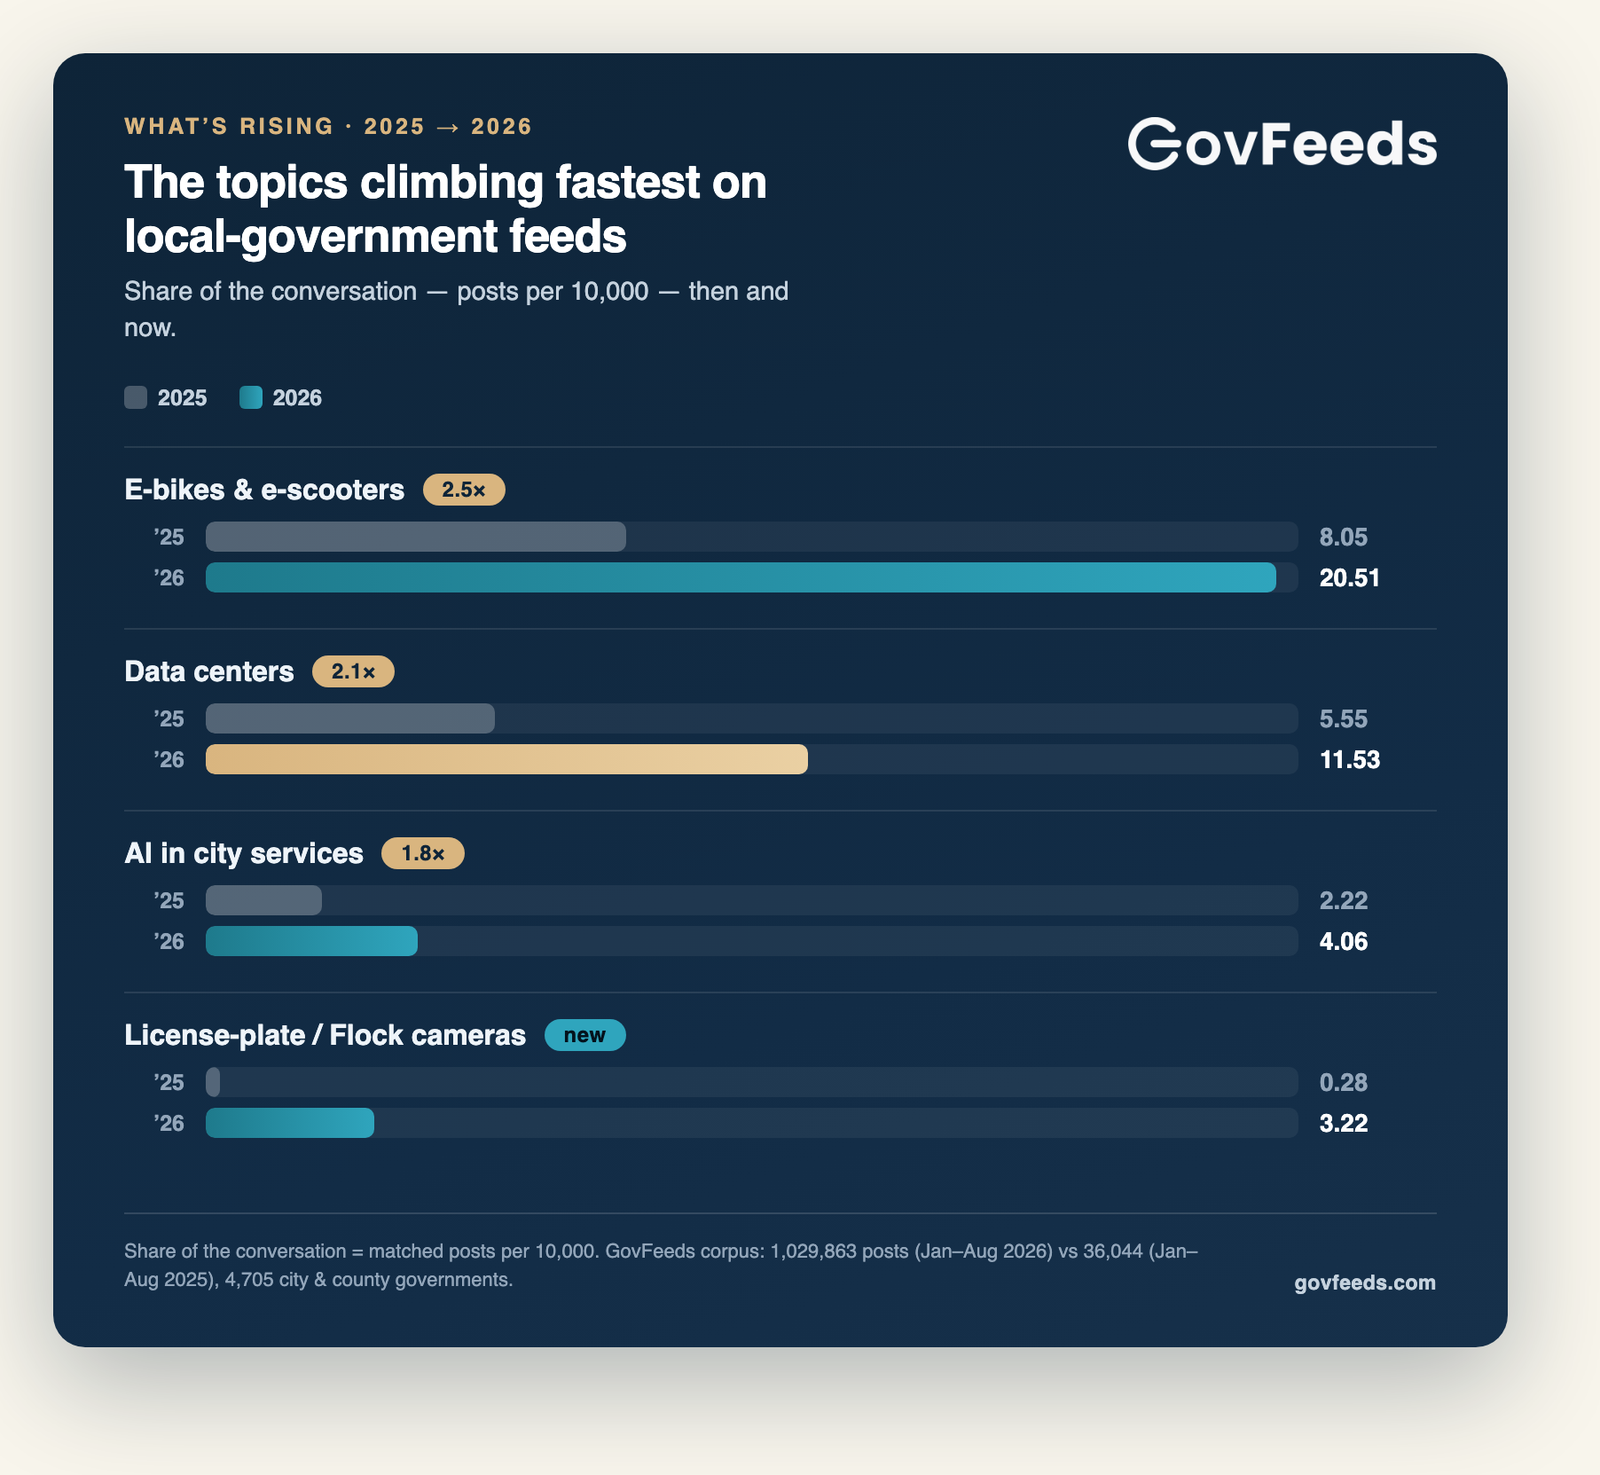
Posts and governments count deduplicated 2026 posts (Jan–Aug). “Growth” is the 2026 share of all posts divided by the 2025 share; the panel column repeats that calculation on the 1,480 governments active in both years. Cameras went from a single matched post in the 2025 window, so we report the arrival rather than a multiplier off a base of one.
Data centers are the clearest case. Their share of the conversation roughly doubled, and — unusually — the growth is larger, not smaller, when we hold the panel of governments fixed (2.75×). That’s the signature of a topic spreading within established government pages, not just riding the arrival of new ones. E‑bikes and e‑scooters are the widest-reaching, showing up on nearly a thousand government feeds. License‑plate cameras are the newest: a topic that barely existed on local-government pages a year ago and is now a standing item for hundreds of them. And AI — chatbots, permitting assistants, “we’re piloting” announcements — nearly doubled.
What these posts look like
The pattern is consistent — a concrete local decision or a resident question, not a celebration. A few real examples from the top of each topic:
- Data centers — the City of Cleveland, Ohio announcing it had rejected a data-center permit; Skagit County, Washington adopting a moratorium on new ones; and the City of Abilene, Texas posting plainly about “data center water usage.” Water, power, and land use — not ribbon-cuttings.
- License‑plate cameras — the Texarkana, Texas police department opening with “we’ve heard some questions — and honestly, some misunderstandings — about our Flock cameras,” and the City of Salem, Massachusetts announcing it would not renew its Flock Safety contract. Both are among the highest-engagement posts we measured on the topic.
- E‑bikes & scooters — Holly Springs, North Carolina with “Attention e‑bike and e‑moto riders,” and St. Tammany Parish, Louisiana responding to “numerous reports of irresponsible e‑bike riders.” The angle that lands is clarifying the rules, by device and location.
Here are three of those posts as residents saw them, one from each rising topic. Engagement figures are the ones the live post displays.
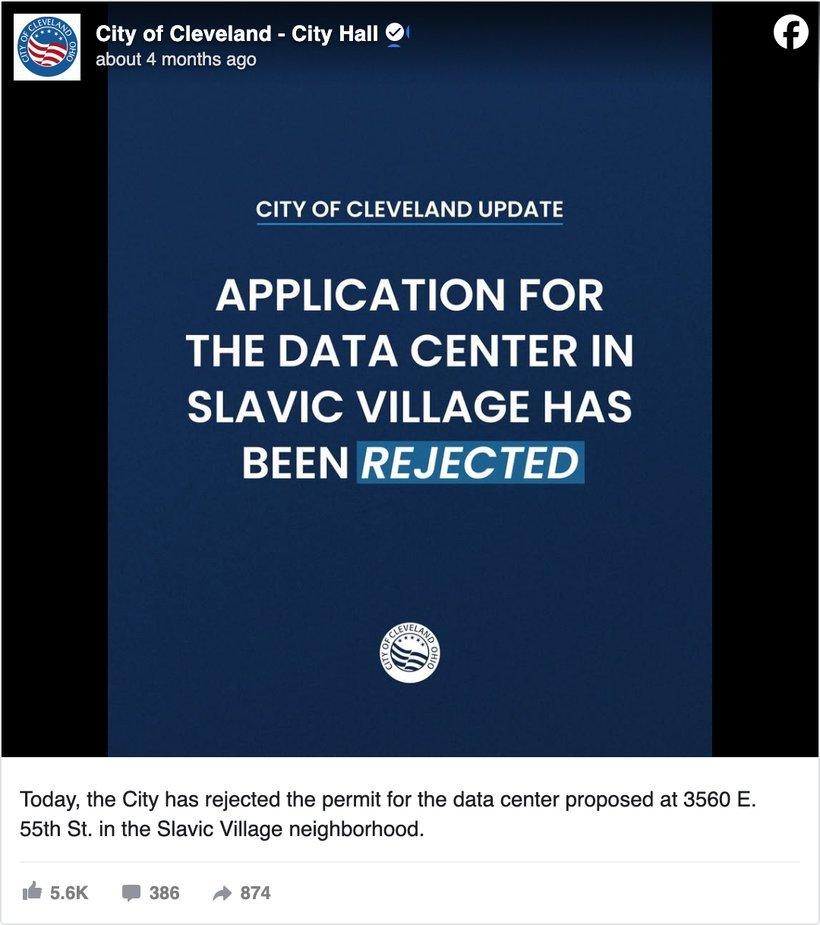
The data-center post in miniature: a land-use decision, stated plainly, with the specific site named — “the City has rejected the permit for the data center proposed at 3560 E. 55th St.” No ribbon-cutting, no rendering — and nearly 900 residents forwarded it. This is what the most robust riser in our data looks like on a feed.

The police department’s explainer names the misunderstandings first, then walks through what the cameras do and don’t do. Look at the thread it drew: comments outnumber reactions better than two to one — the signature of contested content, and exactly the pattern the engagement numbers below predict for camera posts.
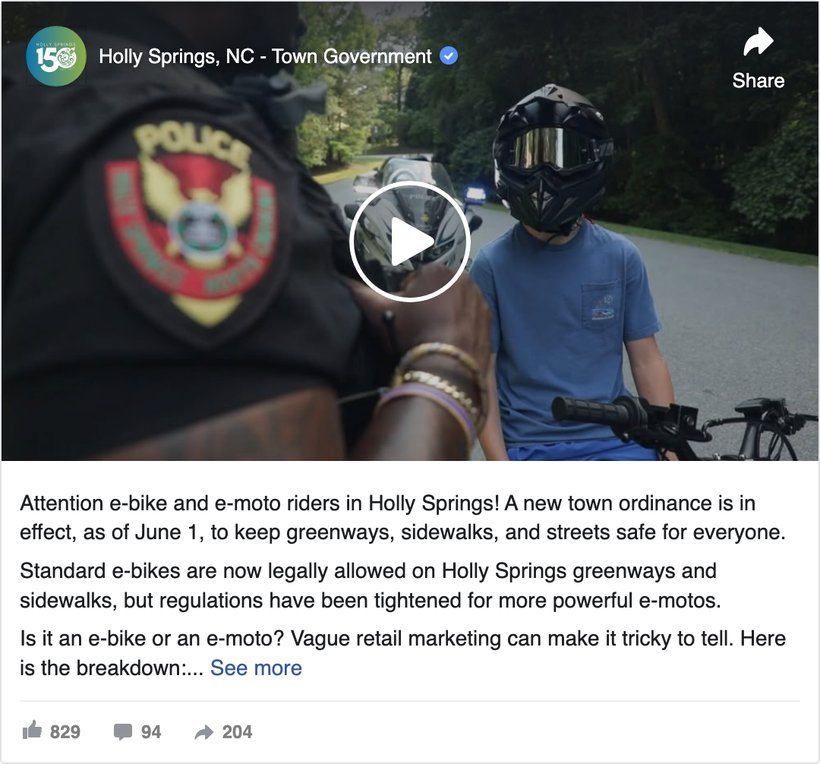
A new ordinance took effect June 1, and the town’s video answers the question residents actually have: is it an e‑bike or an e‑moto, and where can each one ride? “Vague retail marketing can make it tricky to tell. Here is the breakdown.” That rules-by-device clarity is the angle that lands on the broadest riser of the four.
What the four have in common
These aren’t random. Read them together and the same theme runs through all four: they are the topics where technology and land use arrive in a resident’s own neighborhood and someone has questions. A data center means water, power, and truck traffic near a subdivision. E‑bikes and scooters mean new rules about who rides what, and where. License‑plate cameras mean surveillance and a records question. AI means “is a machine handling my request now?”
Two of the four — data centers and cameras — are also genuinely contested, and that is exactly why they show up in the growth data before they show up in a comms plan. Residents raise them first; the government account responds. If a topic on this list hasn’t reached your feed yet, the pattern in the data says it is a question of when, not whether — and the governments already posting about it are the ones worth reading before you have to.
The contested ones don’t just spread — they fill your comments
Rising volume is one thing; rising volume on posts people actually engage with is another. So we measured engagement — reactions, comments, and shares — on each topic, reporting the median post, because a handful of viral posts distort any average. The typical local-government post earns a median of 11 engagements. Here is where the risers land against that line.
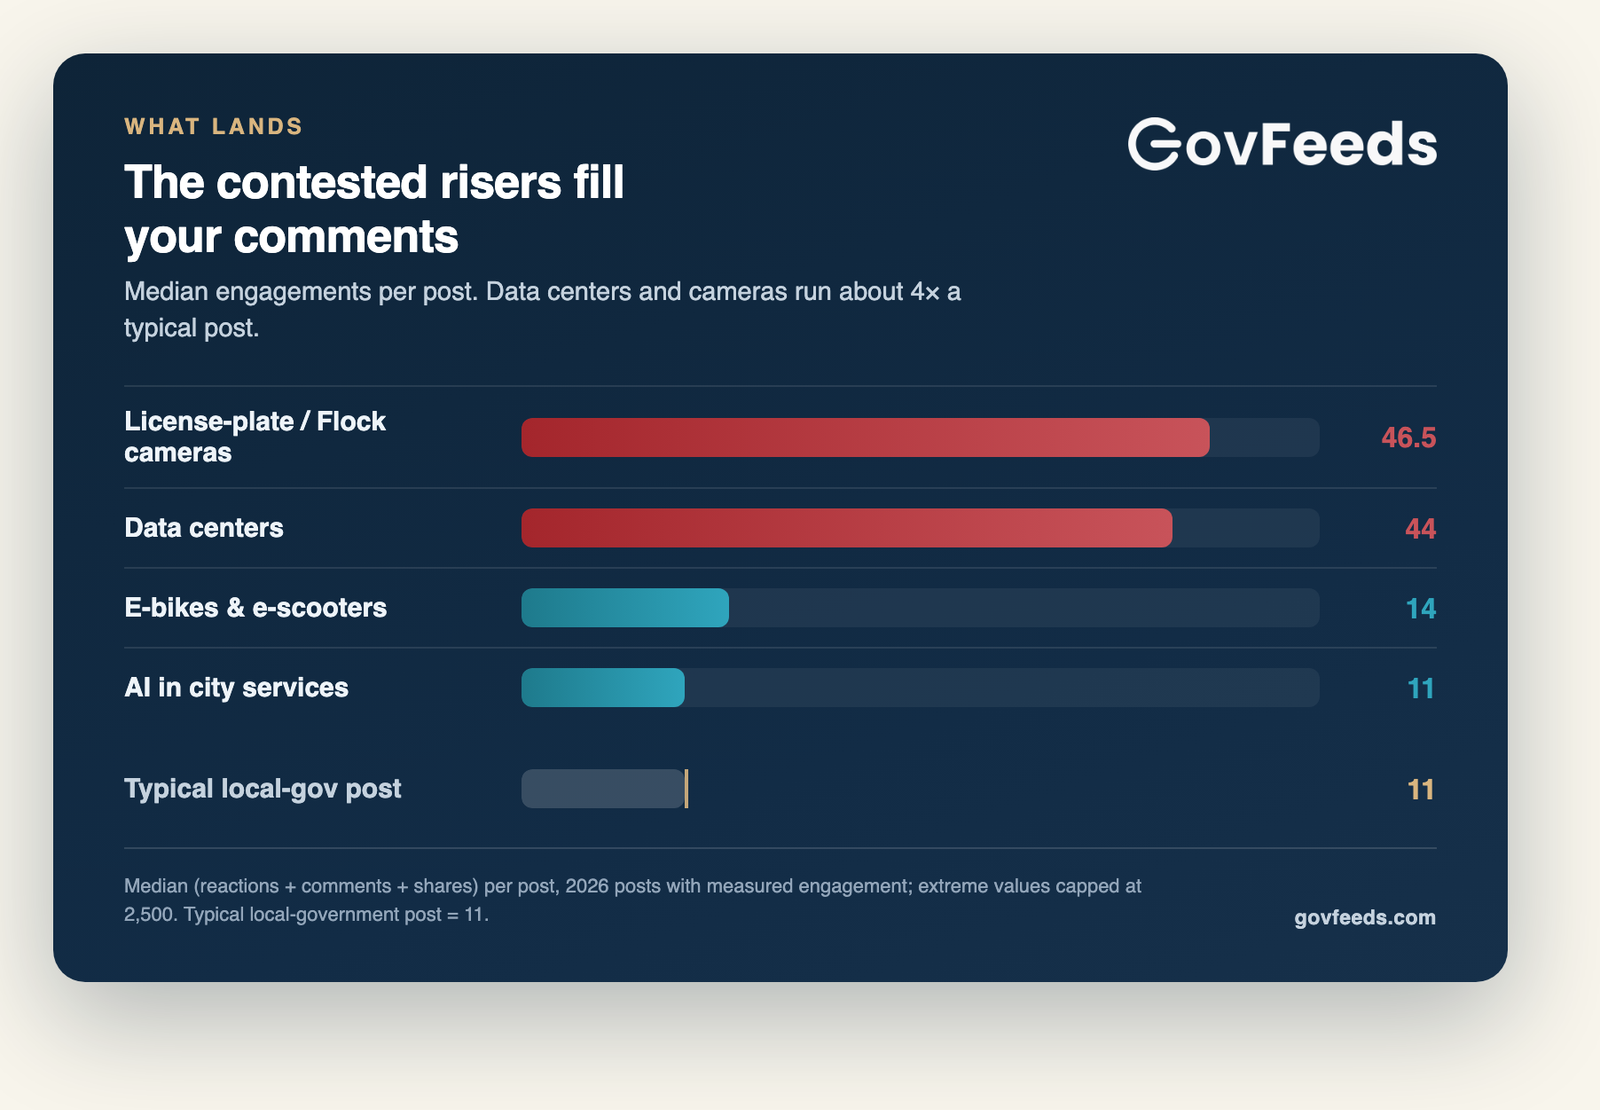
License‑plate cameras and data centers earn about four times the engagement of a typical post — medians near 47 and 44. That is the fingerprint of contested content: people don’t just like it, they argue about it, and they share it to bring neighbors in. (Our separate read on Flock cameras found a third of those posts draw more comments than likes — the most contested content we’ve measured.) E‑bikes sit a little above the line, and AI right on it — for AI, it’s the volume that’s climbing, not the reaction. Worth knowing before you build a post around it: an AI announcement is unlikely to be your engagement moment, but a data-center or camera post almost certainly will draw a crowd, whether or not you’re ready for it.
And some topics you’d expect aren’t rising
The counter-examples are just as useful, because they keep you from chasing a trend that has already peaked.
- Food trucks and pickleball are big but flat. Food trucks are the single most-posted topic we tracked here — 11,532 posts from more than 2,000 governments — and pickleball is on more than a thousand feeds. But neither is gaining share; they’re already mainstream. They’re reliable community content, not a rising wave.
- Broadband and opioid/overdose messaging receded as a share of the conversation — each fell by more than half. Governments didn’t stop posting about them, but the rest of the feed grew faster around them, which usually means a funding cycle or a public-health push has moved past its peak.
- Homelessness holds steady and engages hard — a median of 22, twice the typical post — without gaining much share. A durable, high-stakes topic rather than an emerging one.
What to do with this
- Treat the four risers as your early-warning list. Data centers, e‑bikes, cameras, and AI are arriving on peer feeds ahead of the average calendar. If yours is coming, the useful move is to see how peers framed the first post before the questions start — not after.
- Prepare the contested two before you need them. Because data-center and camera posts draw roughly 4× the engagement, the comment thread is the real work. Have your answers to the obvious questions — what it captures, who sees the data, how long it’s kept; water, power, traffic — ready before you publish. We’ve written starting points for posting about a data center, license‑plate cameras, and e‑bikes and scooters.
- Don’t over-invest in what’s already peaked. Food trucks and pickleball are dependable, but they’re not where attention is moving. Use them; don’t build a strategy around them.
- Check your own community against its real peers. These are national patterns. What’s rising in a fast-growing exurb is not what’s rising in a built-out inner-ring suburb. The useful question is what’s climbing for governments like yours — same size, same region — which is what GovFeeds is built to show.
How we measured this
Nothing here relies on private analytics — every number comes from posts any resident could see.
Frequently asked questions
What topics are local governments posting about more in 2026?
Four topics gained the most ground year over year: data centers (about 2× their 2025 share, and 2.75× among governments tracked in both years), e‑bikes and e‑scooters (about 2.5×, and the broadest at 967 governments), license‑plate/Flock cameras (from a single post in our 2025 window to 332 posts across 217 governments), and AI in city services (about 1.8×). All four sit at the intersection of technology, land use, and a resident’s own neighborhood.
Which of these topics gets the most engagement?
License‑plate cameras and data centers — both earn a median around 44–47 engagements per post, roughly four times the typical local-government post’s median of 11. They’re contested, so residents comment and share rather than just react. E‑bikes run a little above the typical post, and AI posts engage about like an average post — for AI it’s the volume that’s rising, not the reaction.
Is this just because you added more governments to the dataset?
We checked for exactly that. Beyond measuring each topic’s share of the conversation (which already controls for total volume), we recomputed the trends using only the 1,480 governments that posted in both the 2025 and 2026 windows. The risers still rise on that fixed panel — data centers actually grow more — so the pattern isn’t an artifact of broader coverage.
What isn’t rising?
Some topics you might expect to be surging aren’t. Food trucks (the most-posted topic here) and pickleball are large but flat — already mainstream rather than growing. Broadband and opioid/overdose messaging each fell by more than half as a share of the conversation. Homelessness holds steady and engages well (a median of 22) without gaining much share.