Where a Local Government’s Social Media Engages Residents, Incumbents Do Better at the Polls
We matched the results of more than 5,300 local races held in 2026 in five states to how much residents engaged with each government’s official social media in the months before the election. One pattern held up across every way we checked it: where a government’s social media drew more engagement from residents, the mayors, council members and commissioners running for re-election did better. We can’t say that engagement caused those results. But the association points to something communicators have long believed: engaged communication and residents’ buy-in to the work of local government go together.
- In contested 2026 races in North Carolina, Virginia, Louisiana, Minnesota and Georgia, incumbents in governments whose Facebook presence drew above-average engagement got 9.1 points more than an even split of the vote, compared with 6.7 points where engagement was below average, after adjusting for population, office, party and county partisanship.
- Put another way, each standard deviation of engagement went with about 2 points more vote share and about 3 points higher odds of winning (on a base where 83% of incumbents won).
- On Instagram, with far fewer governments to compare, the gap pointed the same way and was larger: 11.7 points versus 5.4.
- This is an association, not proof of cause. Well-run, well-liked governments may draw both engagement and votes. The sections below cover what the pattern can and can’t tell you.
In this piece: What we looked at · The Facebook result · Instagram · What we can’t conclude · What other research says · What it means for your work · How we measured · References
What we looked at
Local elections are a rare, public test of how residents feel about the people running their government. So we put together every local race on the 2026 ballot in five states whose election offices publish complete results: North Carolina, Virginia, Louisiana, Minnesota and Georgia. That came to 5,317 races in 2,315 cities, towns, townships and counties, for mayor, council, county commission and similar offices, with 3,769 incumbents seeking another term.
For each government, we then looked at its official social media accounts, the ones run by the town or county itself, not any candidate’s campaign page. We measured how much residents engaged with that social media (likes, comments and shares) from January 1, 2026 up to the day before the election. Facebook could be measured for 774 incumbents in 292 governments; Instagram for far fewer.
That distinction matters for reading everything below. This is not campaign communication. It is the everyday social media a communications team runs about road work, park events, budget hearings and trash pickup. The question is whether residents’ engagement with that everyday communication says anything about how they treat the officials responsible for the government’s work.
The Facebook result: more engagement, stronger incumbents
The chart below compares incumbents in contested races. It shows how far above an even split of the vote they finished (in a two-person race, an even split is 50%; in a race with four candidates for two seats, it is also 50%; with three candidates for one seat, it is 33%). Incumbents usually beat that line. The question is by how much.
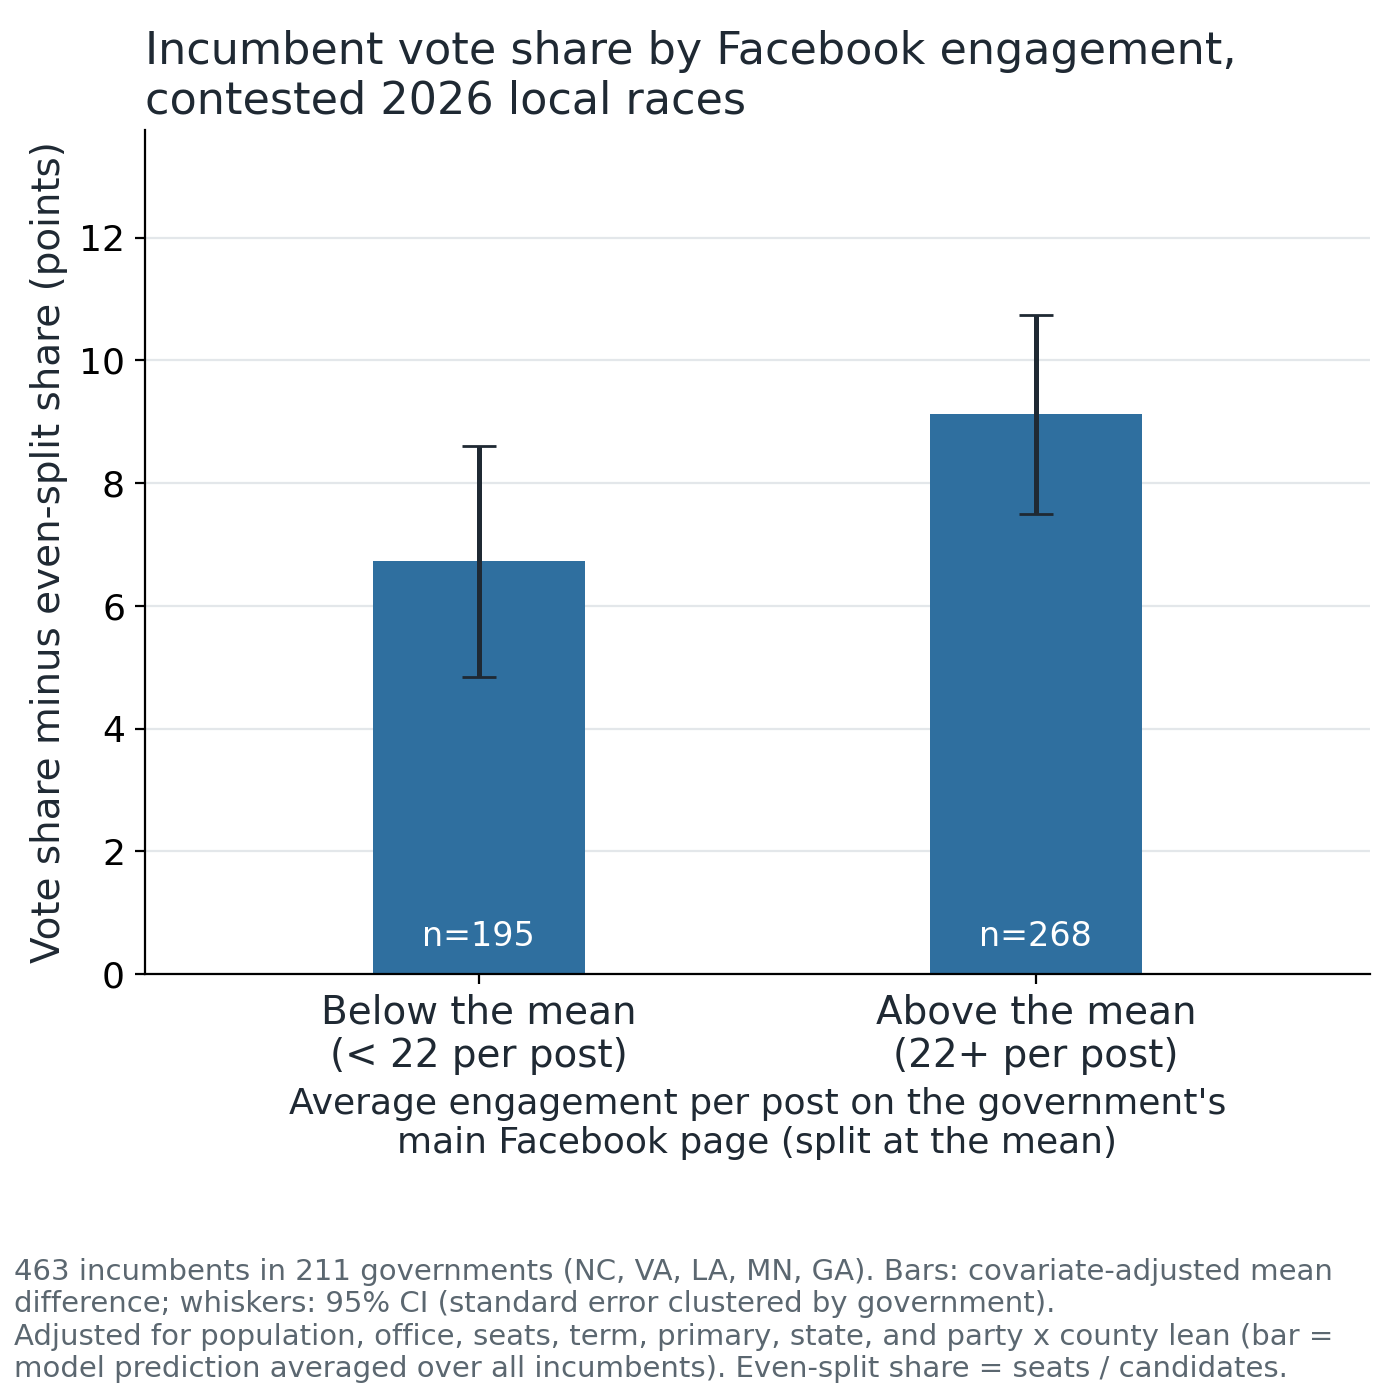
Where the government’s Facebook presence drew below-average engagement, incumbents finished 6.7 points above an even split. Where it drew above-average engagement, 9.1 points. That 2.4-point gap is modest, and with these two broad groups it falls just short of the usual bar for statistical confidence (p = 0.08). Treating engagement as a continuous measure rather than splitting it in two gives a cleaner reading: each standard deviation of engagement goes with 2.2 points more vote share (p = 0.03) and a 3.3-point higher chance of winning (p = 0.02), counting uncontested and contested races alike.
What gives us some confidence that this is more than noise is how stable it has been. The estimate was positive in our first run on North Carolina, Virginia and Louisiana, and it became more precise as we added Minnesota and then Georgia, with each new state pointing the same way. It holds counting all of a government’s Facebook pages instead of only the main one (+3.3 points on winning), in November general elections alone (+3.5), and after controlling for how the same incumbent did in their last election (+4.9).
Instagram points the same way
Far fewer local governments are active on Instagram than on Facebook, so this is a much smaller test: 57 incumbents in 34 governments in contested races. With samples this small, the margin of error is wide, so read it as a check on direction more than a precise estimate.
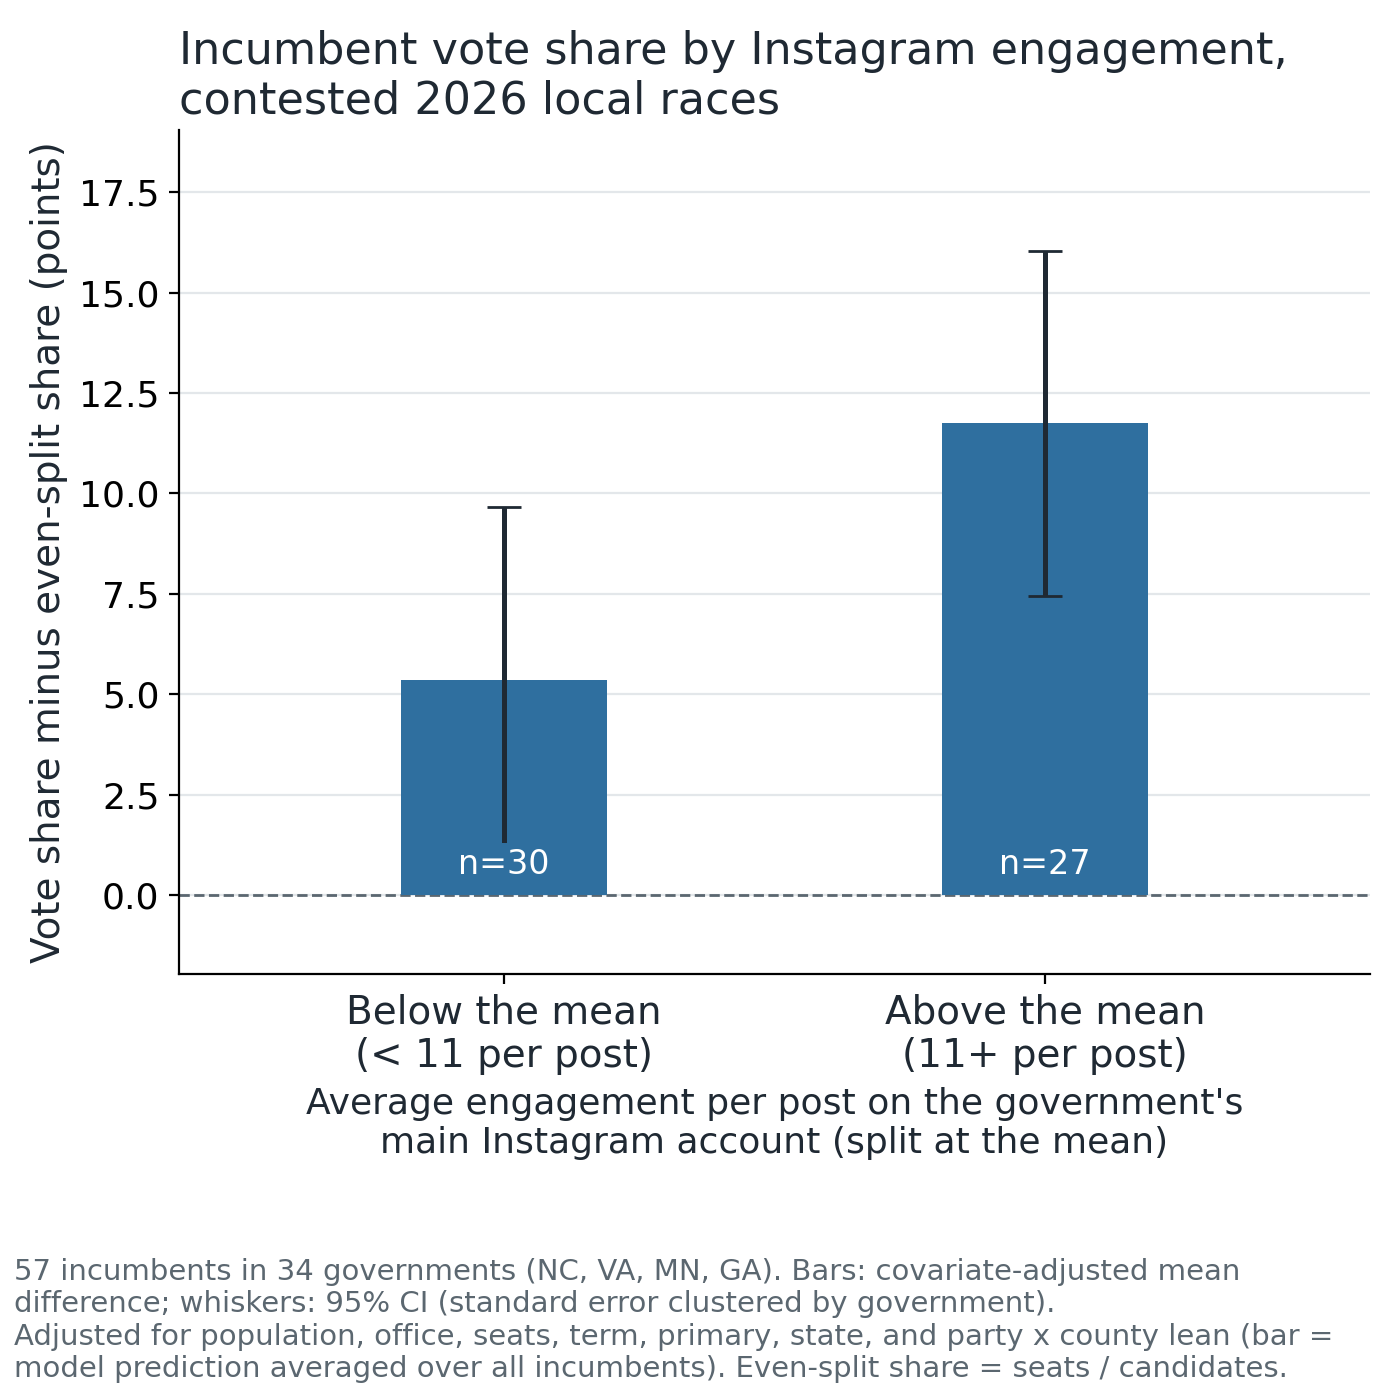
Below-average Instagram engagement: 5.4 points above an even split. Above average: 11.7 points. The gap (6.4 points) is again just short of conventional confidence on its own (p = 0.07), and the continuous estimate is stronger: about 8 points of vote share per standard deviation of engagement (p = 0.01). Two different platforms, with different audiences and mostly different governments, show the same pattern.
What we can’t conclude
We want to be clear about the limits here, because the result is easy to over-read. This study does not show that better social media wins elections, and it isn’t evidence that a government’s communications team can or should influence an election. Several other explanations fit the same pattern:
- Well-run governments may earn both. A town where residents are happy with services and leadership is likely to engage with the town’s social media and to re-elect its officials. Engagement would then be a sign of satisfaction, not a cause of votes.
- Popular officials may lift engagement. When a well-liked mayor appears in a ribbon-cutting photo, residents may respond because of who is in it.
- Community character. Places with strong civic life, local news coverage or close-knit neighborhoods may engage more online and treat incumbents differently, for reasons we can’t measure.
- Who is in the sample. We can only measure governments with active accounts, and those tend to be larger. The study covers one election year in five states. Engagement counts include every kind of reaction and comment, including critical ones.
- Many tests. We ran many models across measures and platforms. The engagement result is the one that kept recurring, which is why we report it, but it deserves replication in other states and years.
Even so, the pattern means something. Whatever the direction of cause, the governments whose residents respond most to their communication are the same governments whose residents most often send their officials back for another term. Engagement with a government’s everyday social media appears to be bound up with residents’ trust in, and buy-in to, the work those officials are doing. That is consistent with what two decades of research on government communication has found.
What other research says
No earlier study we know of has linked a local government’s own social media engagement to the election results of its officials. But the finding sits comfortably within several lines of published research.
Communication and trust in government
Survey research has repeatedly found that residents who use their government’s website and social media report more trust in that government. Tolbert and Mossberger (2006) found this for local government websites in a national U.S. survey. Kim and Lee (2012) traced the link through perceived transparency in local e-participation, and Song and Lee (2016) found the same pathway for government social media: use goes with seeing government as more transparent, which goes with more trust. Porumbescu (2016) found that following government social media accounts was associated with higher trust and satisfaction. Every one of these studies is correlational too, which is part of why the pattern in election results is worth having: it is a behavioral outcome, not a survey answer.
Engaging communication, not just communication
The research also suggests that what matters is whether communication actually engages residents. Hong (2013) found that whether residents’ experiences with government websites and social media were successful mattered for trust, and that an unsuccessful experience could lower it. Experiments by Grimmelikhuijsen and Meijer (2014) show that releasing more information does not automatically raise trust; how it is delivered matters. Bonsón, Royo and Ratkai (2015) studied which kinds of media and content drew residents’ engagement on municipal Facebook pages, a reminder that engagement depends on what a government chooses to post and how.
Local information and local elections
A separate line of research shows that the information residents receive shapes local electoral politics. Hayes and Lawless (2018) found that as local news coverage of congressional races declined, residents became less engaged in those races. Rubado and Jennings (2020) found that cities whose newspapers cut newsroom staff sharply saw less competition in mayoral elections. As local newsrooms shrink, a government’s own channels carry more of what residents learn about its work, which raises the stakes on that communication.
Social media and vote share
Studies of candidates’ campaign accounts have found small associations with vote share. Bright and colleagues (2020) found that candidates’ Twitter campaigning in two U.K. general elections was associated with modest vote gains, comparable in size to campaign spending. Our study differs in an important way: the accounts we measured belong to governments, not candidates, and they do not campaign. That their engagement still tracks incumbents’ results is consistent with the idea that residents’ response to their government’s communication reflects how they feel about the government as a whole.
Why incumbents win
Finally, research on local incumbency is a useful caution. Trounstine (2011) found evidence of an incumbency advantage in city elections but noted that part of what looks like an advantage of holding office can reflect qualities incumbents already had. The same caution applies here: engagement and electoral strength may both reflect qualities of the officials and governments involved.
What it means for your work
For a local government communicator, the practical lessons don’t depend on settling the question of cause.
- Measure engagement. Engagement is the measure that tracked with how residents treated their officials. If you report one number to your manager or council, make it the one that shows residents are engaging.
- Engagement is a signal of buy-in worth watching. If residents engage when you share news about the budget, a park project or a new program, that is a sign they are following and invested in the work. A drop may be worth a look.
- Learn from peers whose residents engage. The governments with the most engaged audiences in your state are a good place to look for approaches worth adapting to your community.
- Keep official channels nonpartisan. Nothing here is a case for using government accounts to promote officials or campaigns, which most jurisdictions restrict. The association is with everyday public-service communication done well, and that is where the value lies.
- It strengthens the case for the function. Communication that residents engage with appears to go hand in hand with confidence in local government. That is a reasonable point to make when leadership weighs the value of communications staff and tools, with the honest caveat that it is an association.
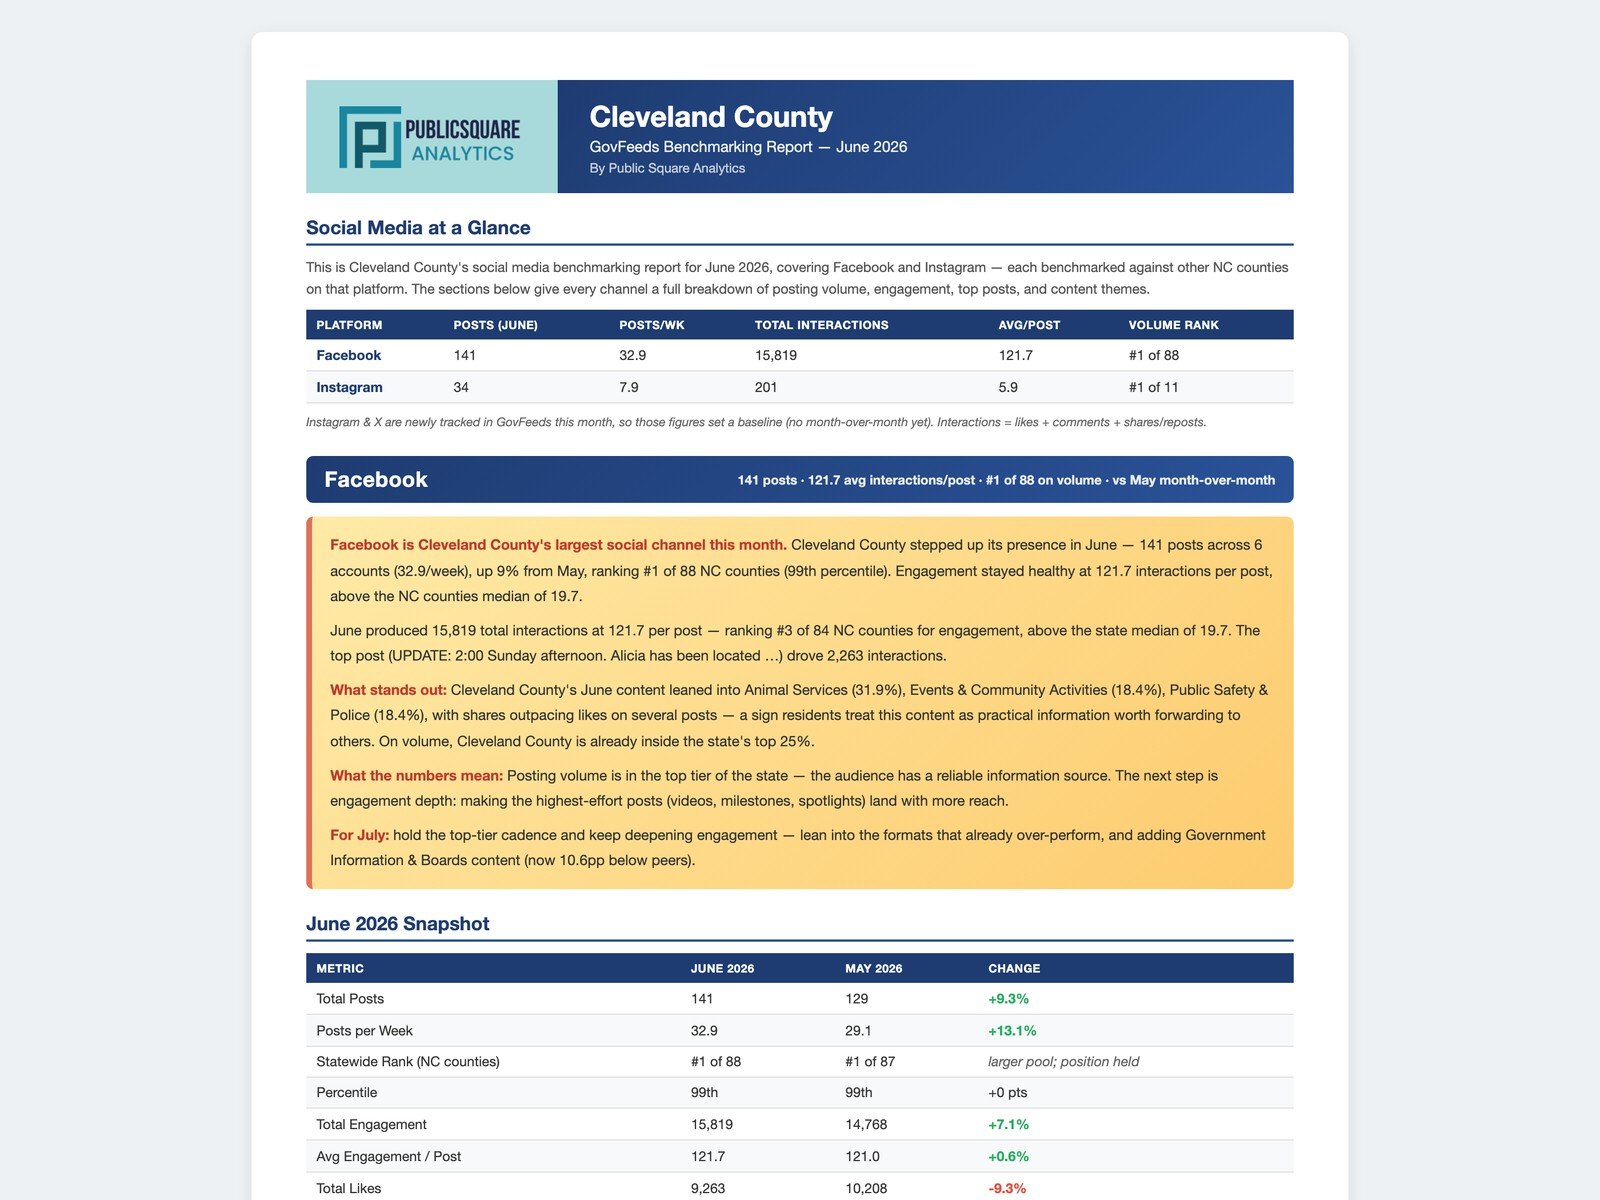
GovFeeds reports your social media engagement month by month next to similar governments in your state, and shows what drew residents in, for you and for your peers. It is built to hand to a manager or council.
“An exceptional way for people to look for ideas and comparisons.”
Communications Specialist, Municipal Government, Iowa
Team plans start at $80 a month for five users, under most purchasing-card limits, so there is usually no procurement process. Checkout is the signup: you are in the app about two minutes later.
How we measured
Elections. Official results from the state election offices of North Carolina, Virginia, Louisiana, Minnesota and Georgia for every 2026 municipal and county governing-board race (mayor, council, board of commissioners or supervisors, township supervisors, parish council or police jury, and similar), including primaries and runoffs. School boards, sheriffs, judges and special districts are excluded. Incumbents were identified from each office’s previous election results, or from the state’s own incumbent flag where it has one. 5,317 races in 2,315 governments; 3,769 incumbents with a known result.
Social media. Public posts on each government’s official accounts, as recorded by GovFeeds, from January 1, 2026 to the day before the government’s election, with at least 60 days observed. Engagement is likes plus comments plus shares on Facebook, and likes plus comments on Instagram, averaged per post on the government’s main account; posts without an engagement reading are left out of the average. For the models, engagement is logged and standardized.
Models. Linear models of winning (all races) and of vote share (contested races), with controls for log population, office type, seats up, unexpired terms, primary versus general election, state, and the incumbent’s party interacted with the county’s 2024 presidential vote (nonpartisan races are their own category). Standard errors are clustered by government. The bars in the charts are the model’s predicted vote share above the even-split share (seats divided by candidates) for each engagement group, averaged over all incumbents in the sample.
References
- Bonsón, E., Royo, S., & Ratkai, M. (2015). Citizens’ engagement on local governments’ Facebook sites. An empirical analysis: The impact of different media and content types in Western Europe. Government Information Quarterly, 32(1), 52–62. doi:10.1016/j.giq.2014.11.001
- Bright, J., Hale, S. A., Ganesh, B., Bulovsky, A., Margetts, H., & Howard, P. (2020). Does Campaigning on Social Media Make a Difference? Evidence From Candidate Use of Twitter During the 2015 and 2017 U.K. Elections. Communication Research, 47(7), 988–1009. doi:10.1177/0093650219872394
- Grimmelikhuijsen, S., & Meijer, A. J. (2014). Effects of Transparency on the Perceived Trustworthiness of a Government Organization: Evidence from an Online Experiment. Journal of Public Administration Research and Theory, 24(1), 137–157. doi:10.1093/jopart/mus048
- Hayes, D., & Lawless, J. L. (2018). The Decline of Local News and Its Effects: New Evidence from Longitudinal Data. The Journal of Politics, 80(1), 332–336. doi:10.1086/694105
- Hong, H. (2013). Government websites and social media’s influence on government-public relationships. Public Relations Review, 39(4), 346–356. doi:10.1016/j.pubrev.2013.07.007
- Kim, S., & Lee, J. (2012). E-Participation, Transparency, and Trust in Local Government. Public Administration Review, 72(6), 819–828. doi:10.1111/j.1540-6210.2012.02593.x
- Porumbescu, G. A. (2016). Comparing the Effects of E-Government and Social Media Use on Trust in Government: Evidence from Seoul, South Korea. Public Management Review, 18(9), 1308–1334. doi:10.1080/14719037.2015.1100751
- Rubado, M. E., & Jennings, J. T. (2020). Political Consequences of the Endangered Local Watchdog: Newspaper Decline and Mayoral Elections in the United States. Urban Affairs Review, 56(5), 1327–1356. doi:10.1177/1078087419838058
- Song, C., & Lee, J. (2016). Citizens’ Use of Social Media in Government, Perceived Transparency, and Trust in Government. Public Performance & Management Review, 39(2), 430–453. doi:10.1080/15309576.2015.1108798
- Tolbert, C. J., & Mossberger, K. (2006). The Effects of E-Government on Trust and Confidence in Government. Public Administration Review, 66(3), 354–369. doi:10.1111/j.1540-6210.2006.00594.x
- Trounstine, J. (2011). Evidence of a Local Incumbency Advantage. Legislative Studies Quarterly, 36(2), 255–280. doi:10.1111/j.1939-9162.2011.00013.x
The election analysis is original GovFeeds research and has not been peer reviewed.
Frequently asked questions
Does more social media engagement help local incumbents win re-election?
In 2026 local races in five states, incumbents did better where residents engaged more with the government’s official social media: about 2 points more vote share and a 3-point higher chance of winning per standard deviation of engagement. This is an association, not proof of cause. Well-run, well-liked governments may draw both engagement and votes.
Was this campaign social media?
No. We measured the official accounts run by each town, city or county, the everyday communication about services, events and projects, not candidates’ campaign pages. Government accounts should stay nonpartisan, and nothing in this research suggests otherwise.
How does this fit with other research?
Survey studies have found for two decades that residents who use their government’s website and social media report more trust in it (Tolbert and Mossberger 2006; Song and Lee 2016; Porumbescu 2016), and that what matters is whether the experience engages and serves them (Hong 2013; Grimmelikhuijsen and Meijer 2014). This study adds a behavioral outcome, election results, that points the same way.
See what your residents respond to.
GovFeeds tracks social media engagement for thousands of local governments, so you can see what engages residents in communities like yours, borrow the ideas that fit, and show your leadership what is working.
“We are living for these benchmark reports!”