Election Posts Get Shared More and Commented On Less. Two in Five Governments Never Publish One.
How much do city and county governments post about elections, when, and what does it earn? Across 1,123,638 public Facebook posts from 4,919 city and county governments over eleven months — a window containing a November general election and a full primary season — we found 16,854 posts about elections: 1.5% of everything local government published. Three patterns stand out. Election posts are shared more and commented on less than a government’s other content. Most governments post about elections rarely or never. And most of what does get posted arrives in the final days before the polls open.
- Election posts get shared more and commented on less. Comparing each government to its own other posts, election content gets a share 5.4 points more often and a comment 3.7 points less often. Shares are 24.7% of the engagement on an election post versus 16.3% on everything else.
- Large comment threads are rarer on election posts. 2.6% drew 25 or more comments, versus 3.3% of everything else.
- Total engagement is a wash — a median of 6 interactions either way, statistically indistinguishable within governments (p = 0.36) — and the ceiling is lower: a 99th percentile of 264 interactions versus 505.
- 39.6% of governments never posted about an election at all in eleven months. The median government posted once.
- It is a three-day event. On Election Day, 21.3% of every local-government post in the country was about the election. Ten days later the topic had fallen to 0.7%, and by late December, 0.2%.
- The one format that reliably outperforms is the thank-you — posts recognizing poll workers, election staff, and new officials earn 2.5× their government's normal engagement. They are 1.6% of election posts.
In this report: How much actually gets said · The three-day spike · Arriving after the deadline · Shared more, commented on less · What actually engages · What almost nobody posts · What to do · How we measured it
How much election communication actually happens
Very little, and it rises steadily with government size.
Of the 4,559 governments that posted at least 30 times in our window, 39.6% never published a single post about an election. Not a polling place, not a registration deadline, not a results link. The median government across the whole sector published one election post in eleven months — 0.59% of its calendar.
Governments with 30+ posts, September 2025 – July 2026. n = 4,416 with a population match.
Counties out-post cities roughly two to one — a median of 1.06% of the county calendar versus 0.50% of the city calendar — consistent with the county administering elections in most states. Large counties participate most: 76.4% of counties over 50,000 posted about elections, at a median 1.5% of their calendar.
The two rates reach different audiences, though. A resident who follows their town’s page and not the county’s sees only what the town publishes — and in our data, 47.8% of towns under 10,000 published nothing about any election in eleven months.
State-to-state variation is enormous — a tenfold spread — though some of it reflects which states actually held elections in our window rather than differences in effort.
States with 8,000+ posts in the window. National average: 1.50%.
The three-day spike
Election communication is heavily concentrated in time.
On November 4, 2025 — Election Day — 21.3% of every post published by every local government in our corpus was about the election. One in five. The day before, 13.3%. Two days after, 1.2%.
The topic drops 91% in a single week and keeps falling: by late December, 0.23% of all posts — the low for the window.
Arriving after the deadline
Registration is the one election message with a hard legal deadline, which makes its timing measurable against something concrete.
Of everything published before the polls closed, 77.4% landed inside the final 16 days. Across the whole window — 45 days before through two weeks after — just over half of all election posting fell in the final week plus Election Day itself.
2,665 election posts, 45 days before to 14 days after November 4, 2025.
Per government, the pattern is starker. Among the 942 governments that posted about the November election at all:
- The median government's first election post came 7 days before Election Day.
- 53.6% published their first one inside the final week.
- 17.0% waited until Election Day itself.
- 48.4% posted exactly one election post in the entire 45-day run-up.
- Only 10.7% posted five or more.
According to the Movement Advancement Project's tracking of registration deadlines, 22 states close voter registration 16 to 30 days before Election Day, and six more close it 1–15 days out; 22 states and DC allow registration on Election Day itself.
In the run-up to November 4, we found 253 posts specifically telling residents to register or check their registration. 56.5% of them were published inside the final 16 days — and 33.2% in the final week or on Election Day. We did not match each post to its own state's deadline, so we can't say exactly how many arrived after the books closed — but the overlap between the two distributions is substantial: a majority of registration messaging was published inside a window in which registration had already ended in 22 states.
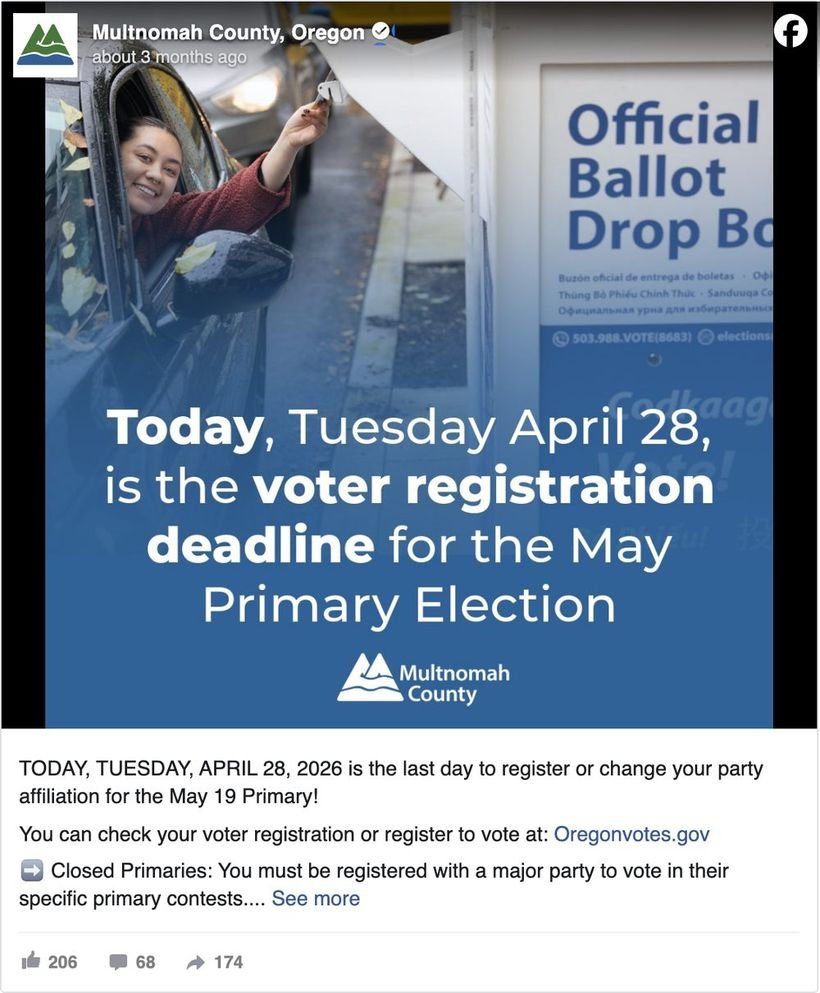
On the morning of Oregon’s registration deadline, Multnomah County posted “TODAY … is the last day to register or change your party affiliation for the May 19 Primary,” explained the closed-primary rule that makes the deadline matter, and linked the state’s registration site. It shows 206 reactions, 174 shares, and a busy comment thread on a page whose median post earns about 10 interactions. Registration is the second-weakest election subject at the median; this post is what the top of its range looks like.
What it earns: shared more, commented on less
We compared each government's election posts to its own non-election posts — same page, same followers, same community — for the 911 governments with at least 5 election posts and 20 others. Three findings:
Paired comparison, 911 governments. Share and comment differences are both significant at p < 0.001 (Wilcoxon signed-rank).
Sector-wide the composition shift is even clearer. On an election post, shares are 24.7% of all engagement and comments 16.8%. On everything else, shares are 16.3% and comments 10.0%. Per like earned, an election post collects 0.42 shares versus 0.22 — nearly twice as forwardable.
That mix is consistent with informational content — posts residents pass along rather than react to. Here is what it looks like on a real page:
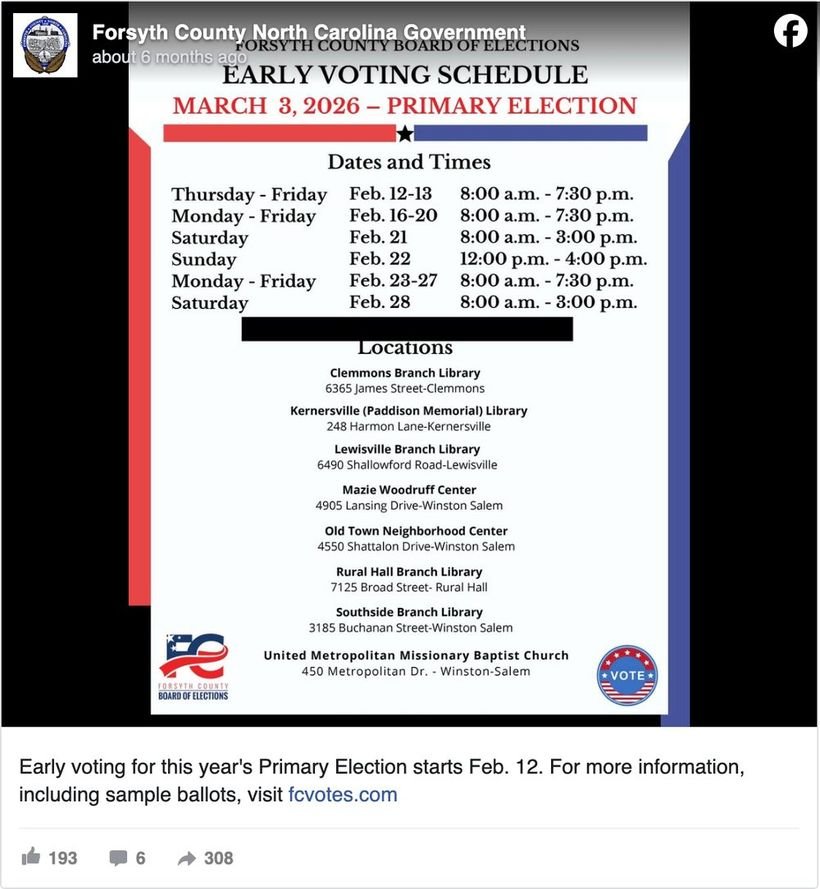
Forsyth County, North Carolina announced early voting in two sentences: the start date, and fcvotes.com for sample ballots. It drew more shares than reactions — 308 against 193 — with just 6 comments, on a page whose median post earns about 6 interactions. It also matches the format profile that gets shared most in our data: under 600 characters, exactly one link.
The flip side: election posts rarely break out. Their 99th percentile is 264 interactions against 505 for everything else. A reliable floor, a low ceiling.
What actually engages
Within election content, the differences between subjects and formats are much larger than the difference between election content and everything else.
By subject
Median interactions per post. Categories overlap — a post can cover more than one. 14,488 election posts with measured engagement.
Results posts lead, and they are only 5.8% of election content. They are also the one category with a real comment load — 39.8% draw a comment and 11.6% draw ten or more — so if there is a moment to plan moderation around, it is results night. Candidate-filing notices perform weakest by a wide margin.
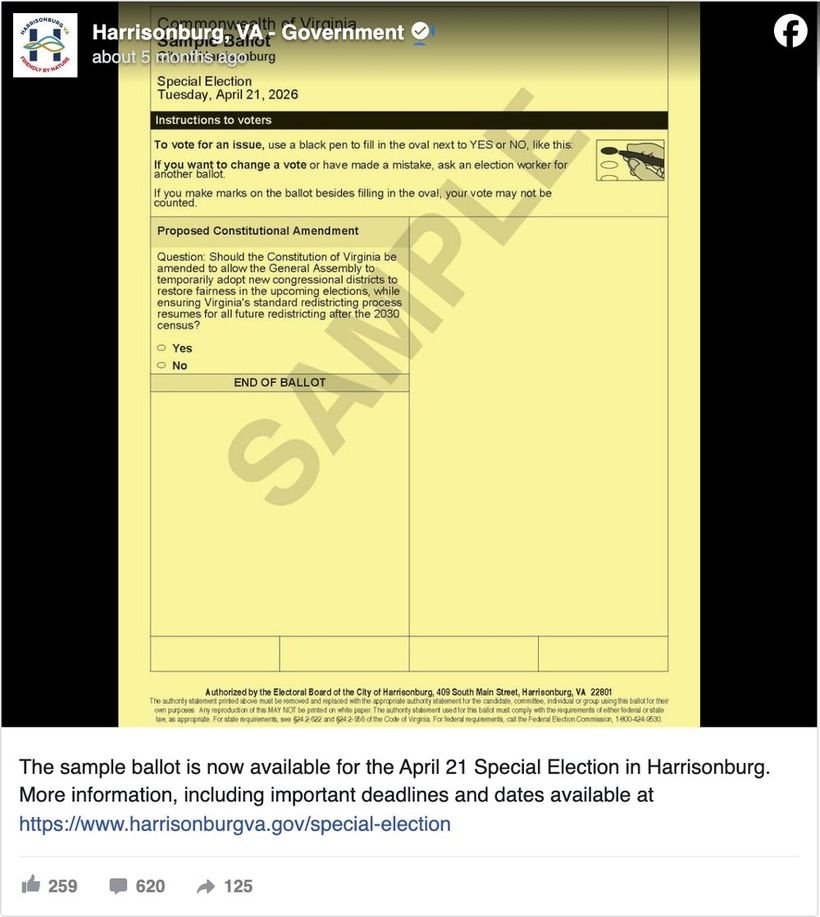
In February, Harrisonburg, Virginia posted a photograph of the actual sample ballot for the April 21 special election — a statewide constitutional-amendment question — with a single sentence and a link. It shows 259 reactions, 620 comments, and 125 shares on a page whose median post earns about 5 interactions: the most over-performing election post in our data relative to its own page. The comment count is worth noting too — ballot content is where election posts do draw discussion.
By format
Length is the largest format effect in the table. The comprehensive “everything you need to know about Tuesday” post — every polling place, every hour, every ID requirement — earns a median of 2 interactions and gets shared less than half the time. The 300–600 character post earns a median of 7 and gets shared two-thirds of the time.
The strongest format in the table is the thank-you. Posts thanking poll workers and election staff, or congratulating newly elected officials, earn 2.5× their own government's median engagement — and among the 21 governments that published enough of both to compare directly, gratitude beat their other election posts 86% of the time. It is 1.6% of election content. Two of the strongest examples in the corpus:
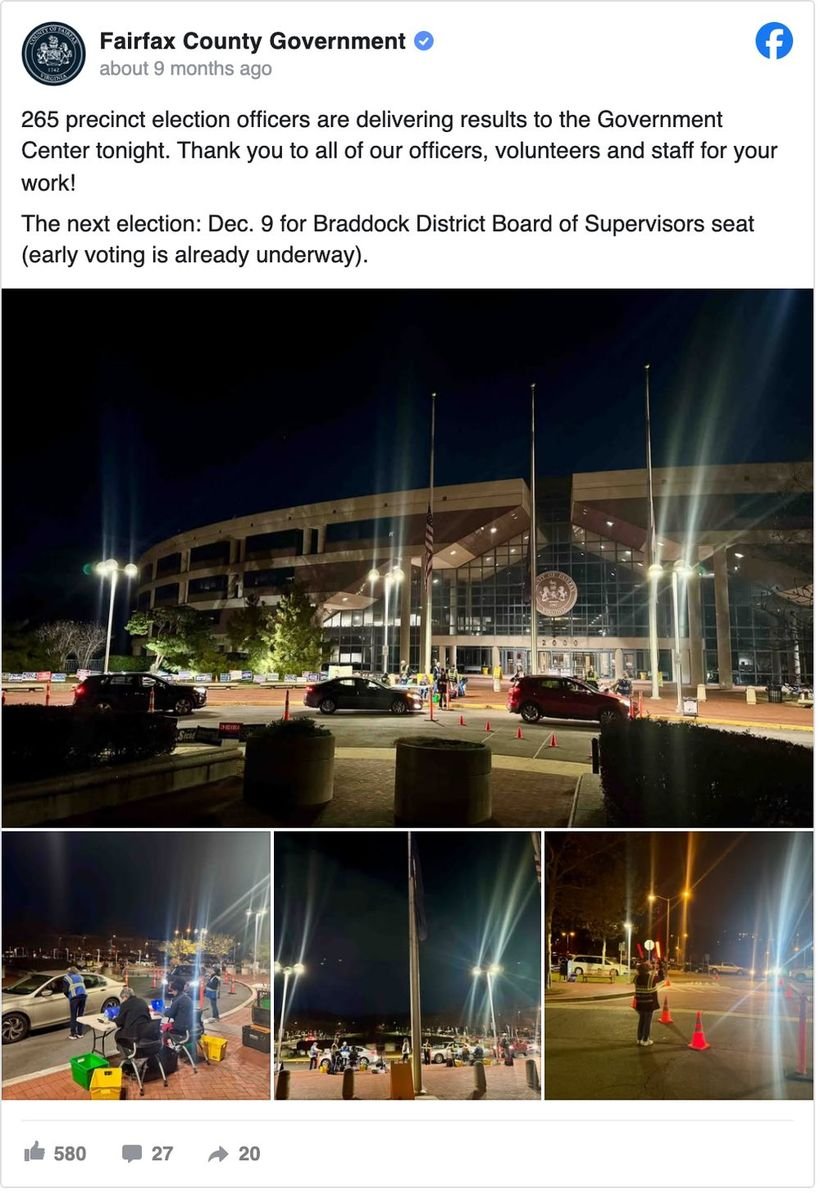
At the close of election night 2025, Fairfax County posted photos of precinct officers delivering results to the Government Center: “265 precinct election officers are delivering results … Thank you to all of our officers, volunteers and staff.” It shows 580 reactions against a page median of about 22 — with just 27 comments, and the date of the next election already in the text.
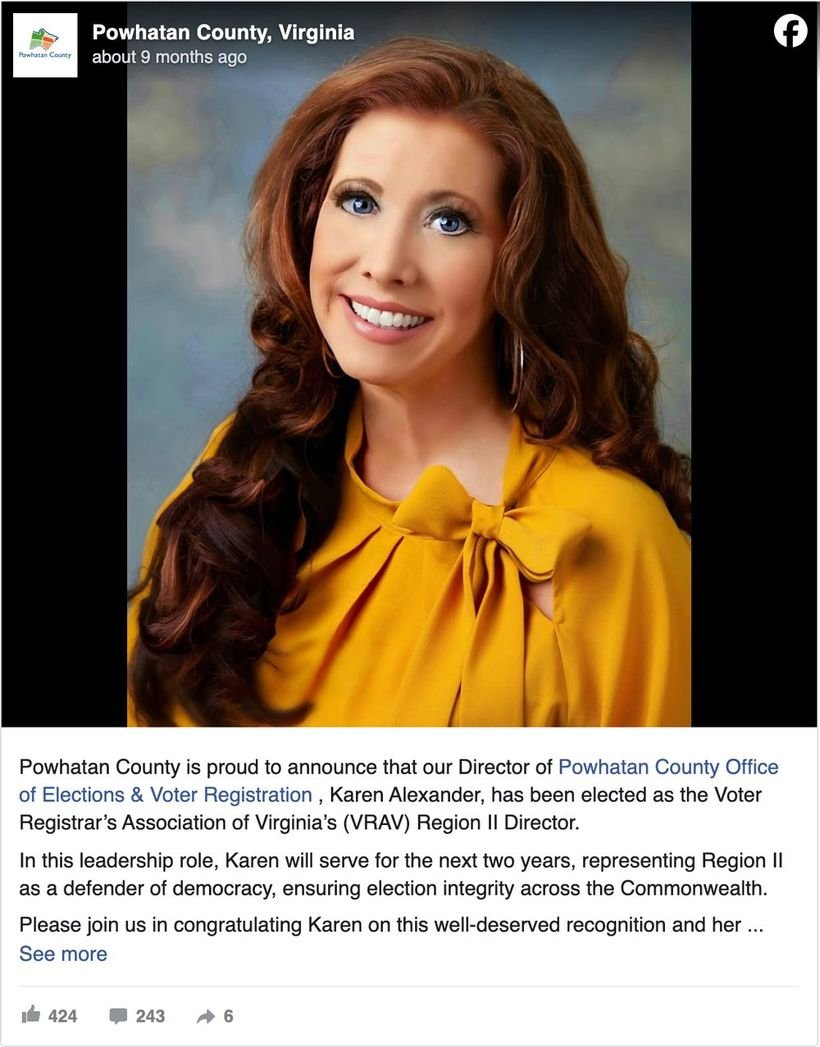
Powhatan County, Virginia announced that its elections director had been elected president of the Voter Registrars’ Association of Virginia. It shows 424 reactions and 243 comments on a page whose median post earns 6 interactions — roughly a hundred times its typical engagement, from a staff-recognition post.
What almost nobody posts
Three kinds of election content are nearly absent from the corpus.
- How elections are run. Posts touching election security, integrity, misinformation, or “here is the official source” account for 0.38% of election posts — 55 posts, from 38 governments out of the 2,572 that posted about elections at all.
- Poll-worker recruiting. Only 324 governments posted a poll-worker call in eleven months. When they did, the posts engaged at the election-content median — there is no engagement penalty for asking.
- Telling people there is nothing on their ballot. We found twelve posts in the entire corpus that told residents they had no local contest and showed them how to check — for example, a large North Carolina city pairing “no city election this year” with a screenshot of the state’s ballot-lookup tool.
What to do with this
- Put one election post on the calendar 30 days out. Not a plan, not a campaign — one post, before registration closes. The median government’s first election post arrives 7 days out, so a single post at day 30 is earlier than most of the sector.
- Cut the comprehensive post in half, then in half again. Aim for 300–600 characters and one link to the page that has the detail. The long version belongs on your website; the short version is what gets forwarded.
- Post the sample ballot the day it is available. Sample-ballot posts beat the category median (7 vs 6, and 65.8% get shared) — and the most over-performing election post in our data, at more than 200 times its page’s typical engagement, was one line plus a photo of the ballot itself (the Harrisonburg case above).
- Plan moderation around results night, not the run-up. Election posts overall draw fewer comments than the average post; results posts are the exception, with a 39.8% comment rate and 11.6% drawing ten or more.
- Publish the thank-you. Poll workers, election staff, the people who counted. It is the best-performing election format we measured, at 2.5× a government’s typical engagement.
- Use the off-season for the items without a deadline. Poll-worker recruiting, filing periods, precinct changes — by December, election content nationally had fallen to 0.23% of posts.
- If you are a city, check what actually reaches your followers. Counties post about elections at twice the rate of cities, but a resident who follows only the town’s page sees only what the town publishes — and 47.8% of towns under 10,000 published nothing.
How we measured this
Nothing here relies on private analytics — every number comes from posts any resident could see.
Frequently asked questions
Do election posts hurt engagement for local governments?
No. Comparing each government to its own non-election posts across 911 governments, election content earns statistically indistinguishable total engagement — a median ratio of 1.00×, p = 0.36. What changes is the mix: election posts get shared 5.4 points more often and commented on 3.7 points less often. They also rarely go viral, with a 99th percentile of 264 interactions versus 505 for other content. Election content neither costs nor buys reach.
Will posting about the election fill my comment section with fights?
Less often than an ordinary post will. Election posts drew 25 or more comments 2.59% of the time versus 3.30% for everything else, and 50+ comments 1.30% versus 1.50%. Mean comments per post were 3.35 versus 4.10. The exception is results night: 39.8% of results posts draw a comment and 11.6% draw ten or more, so that is the shift worth staffing.
When should a city start posting about an election?
Earlier than almost anyone does — at least 30 days out, before registration closes. In 22 states registration closes 16 to 30 days before Election Day. In our data, the median government's first election post came just 7 days out, 53.6% published their first inside the final week, and 17% waited until Election Day itself. A single post at day 30 covering registration and the sample ballot puts you ahead of most of the country.
What kind of election post gets the most engagement?
Gratitude, by a wide margin. Posts thanking poll workers and election staff or congratulating newly elected officials earn 2.5× their own government's median engagement, and beat that government's other election posts in 86% of cases — yet they are only 1.6% of election content. After that: results and winners (median 8 interactions), video (median 12 vs 6), and “the sample ballot is now available” posts. Candidate-filing notices perform worst, at a median of 4.
How long should an election post be?
300 to 600 characters, with one link. That band earns a median 7 interactions and gets shared 67% of the time. Posts over 1,200 characters — the comprehensive “everything you need to know” format — collapse to a median of 2 and get shared only 46% of the time. Put the detail on your website and let the post be the index card.
Should cities post about elections if the county runs them?
Yes, especially for municipal races. Counties do post about twice as much as cities (a median 1.06% of the county calendar versus 0.50%), but residents follow their own town's page. In our data 47.8% of towns under 10,000 posted nothing about any election in eleven months — and those are the places where the municipal contest on the ballot is least likely to be explained by anyone else.
See how peer governments handled their last election.
Search 1.1 million posts from 5,000+ city and county governments — by keyword, state, and population band.